2011 International Conference on Alternative Energy in Developing Countries and Emerging Economies
- 338 -
The mean of the distribution i.e. the mean wind speed,
V
is equal to
1 (1 )
V c
k
*
(4)
Where
*
is the gamma function.
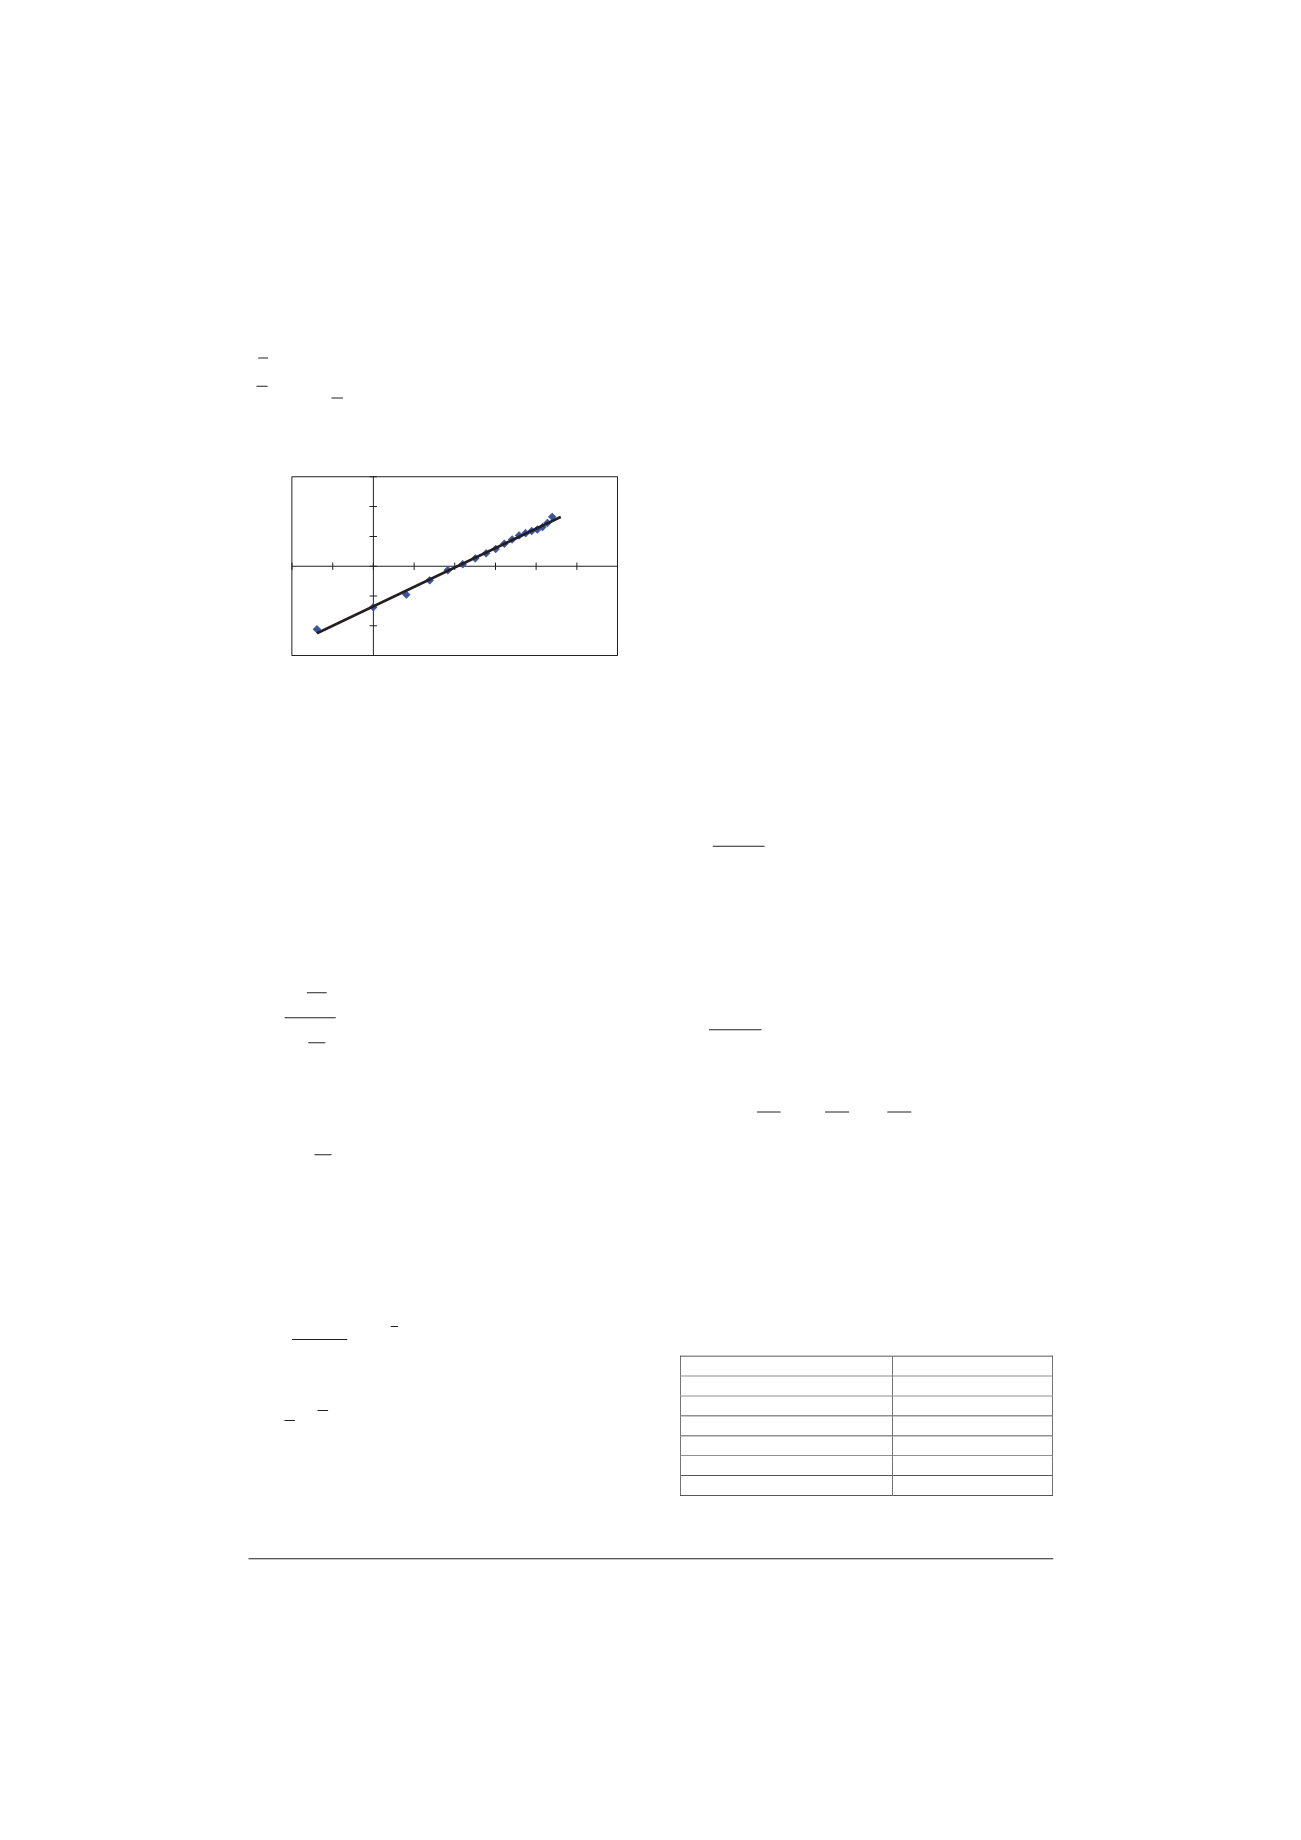
Fig. 4. Graphical method for Weibull parameters analysis.
In this study, Weibull parameters, k-shape and c-scale,
were obtained using WAsP 9.0 program. Wind roses with
16 sector-wise were plotted for display directional wind
regime.
C. Wind Speed at Height of 50 m
Wind energy potential is not easily estimated because
it depends upon the site characteristics and topography to
a large degree as wind speeds are influenced strongly by
local topographical features [5]. The wind statistics
excluding calm of 18 stations were analyzed in order to
compute the site dependent wind shear coefficient using
equation given in Eq. 5.
¸¸
¹
·
¨¨
©
§
¸¸
¹
·
¨¨
©
§
r
r
Z
z
z
V
V
ln
ln
D
(5)
Wind speed at hub height of 1 MW wind turbine
generator (50 m) was extrapolated using wind shear
coefficient as shown in Eq. 6.
D
¸¸
¹
·
¨¨
©
§
r
r
Z
z
z V V
(6)
D. Wind Power
Air density is another key parameter for wind power
potential assessment. The relationships between air
density and air temperature and height are given in Eq. 7.
[17]. However, in WAsP 9.0 analysis, air density is
considered to be constant at 1.225 kg/m
3
.
¸
¹
·
¨
©
§
T
z
a
e
T
034 .0
049 . 353
U
(7)
Power density (
P
) of wind could be computed using
Eq. 8. [15].
3
2
1
V P
a
U
(8)
Wind power class at 50 m height was also identified in
this study.
E. Techno-Economic and CO
2
Emission Avoidance
Assessment of Wind Power
In order to estimate the annual energy production
(AEP) from wind turbine generator, WAsP 9.0 computer
program was used in the analysis. In WAsP analysis, the
vector map was developed by the combination of contour
and roughness maps in WAsP Utility 3.0. The contour
map was developed using DEM 1:50,000 L7018 obtained
from the Royal Thai Survey Department. The roughness
maps were prepared using the land-used information
interpreted from the SPOT5 satellite images with 10 m
resolution collected in 2007. The observed wind climate
during 2008-2010 was analyzed and was used as input
data in AEP analysis. Wind resource around
meteorological mast of 10 km was predicted with the
resolution of 10 m for grid cell and annual energy
production from a 1 MW WTG was estimated. In this
feasibility study, the wind turbine generator with capacity
of 1 MW model BONUS was selected to be installed at
the met station. Technical data of 1 MW wind turbine
generator model BONUS was given in Table II. The
power curve of a 1 MW wind turbine generator is shown
in Fig. 5. The capacity factors of a 1 MW wind power
plant installed at the met station of 18 stations were
analyzed using Eq. 9.
%100
. .
u
u
¸
¹
·
¨
©
§
Hr
WTG
AEP
FC
(9)
where
AEP
is the annual energy production (kWh).
WTG
is the rated capacity of wind turbine generator (W).
Hr
is
the number of hour in a year.
Present values of the cost of wind power must be
estimated considering parameters like inflation and
interest rates. The cost of energy (
CoE
) was determined
for these 18 stations using the following equation [18].
20
u
AEP
PVC
CoE
(10)
The present value cost (
PVC
) was computed using
the following equation [16].
t
omr
r
i
S
r
i
i r
i
C I
PVC
¸
¹
·
¨
©
§
»
¼
º
«
¬
ª
¸
¹
·
¨
©
§ u»¼
º
«¬
ª
1
1
1
1 1
1
(11)
where
I
is initial cost.
omr
C
is operating,
maintenance and replacement cost.
S
is salvage.
i
is
interest rate.
r
is real interest rate.
t
is project lifetime.
For economic analysis, the following assumptions were
used: salvage (10%), project lifetime (20 years), interest
rate (6.38%), inflation rate (3%), and exchange rate (1
US$ = 30.30 Baht). The CO
2
emission avoidance from
wind power was analyzed using the factor of 0.58 kg
CO
2
/kWh.
TABLE
II
T
ECHNICAL DATA OF WIND TURBINE GENERATOR FROM BONUS
Parameter
Technical Data
Cut-in speed (m/s)
4
Cut-out speed (m/s)
25
Rated speed (m/s)
17.5
Rated output (kW)
1,000
Hub height (m)
50
Rotor diameter (m)
54.2
y = 1.3031x - 1.3487
R
2
= 0.9964
-3.0
-2.0
-1.0
0.0
1.0
2.0
3.0
-1.0 -0.5 0.0 0.5 1.0 1.5 2.0 2.5 3.0
ln(V)
ln(-ln(1/(1-F(V))


