investigated the presence of anode MPL under 1 M
ethanol solution. They found that the MEA with MPL
performed poorer than the MEA without anode MPL at
high current density region. It is different because the
decrease of the diffusion porosity by adding anode MPL.
To our knowledge, the design of DEFC-anode MPL
was almost borrowed directly from the DMFC
technology. The effect of mass transport on the
performance of DEFC by modifying anode MPL has not
been investigated by using various characterization
techniques. The objective of this work was to investigate
the effect of anode MPLon the performance of DEFCs.
The cell performances were characterized by using cell
polarization curves. The ac impedance technique was
used to evaluate the mass transport loss at the anode side.
In addition, the long-term current discharging
measurement was demonstrated to determine the mass
transport behavior
.
E
XPERIMENTAL
A.
Materials
Nafion
®
115 membrane (DuPont) was pre-treated by
cleaningwith H
2
O
2
solution and then boiled in 0.5 M
H
2
SO
4
solution followed by washing in de-ionized water
at 70
o
C. Pt-Sn (3:1 a/o) on Vulcan XC72 was used as the
anode catalyst. A commercial gas diffusion electrodeused
as the cathode electrode contains 0.5 mg/cm
2
of Pt on
Vulcan XC72. At the anode, two types of diffusion layers
were used: (i) carbon cloth without micro-porous layer
(MPL) (0 wt. % PTFE) and (ii) carbon cloth with MPL
(20% PTFE).
B.
MEA preparation
The anode catalyst ink was composed of the catalyst,
Nafion
®
ionomer solution, and isopropyl alcohol. This
mixture was ultrasonically agitated to form a
homogeneous ink. The anode CL was all formed by the
CCM method. The hand-printingtechnique was used to
coat both the catalyst inkonto the membraneto obtainthe
catalyst metal loading of 2 mg/cm
2
and the anode MPL
on a carbon cloth. The MEAs were fabricated by hot-
pressing the anode and cathode onto each side of the
Nafion
®
membrane. The active area of the MEA made in
this work was 5 cm
2
. The single cell was sandwiched
between two graphite blocks with a parallel serpentine
flow field, and was clamped on both sides by the current
collector end-plates.The MEA was activated with
hydrogen at the anode and oxygen at the cathodeand was
conducted at 75
o
C for 4 hour. After that, an aqueous
ethanol solution with a specific concentration was fed to
the anode and oxygen was fed to the cathode at 75
o
C for
1 hour prior to the cell performance test.
C.
Performance testing and analysis
For the experimental testing, aqueous solution of
ethanol with concentrations of 0.5, 1.0, and 2.0 M was
fed to the anode, and oxygen was fed to the cathode at 75
o
C cell temperature. Cell polarization testing was carried
out by a computer-controlled Fuel Cell Test station with
an electronic load in a potentio-dynamic polarization
mode. Voltage variation measurement was conducted in
galvanostatic mode. The cell current was controlled and
the cell voltage was recorded with time for 1800
seconds.Anode impedance operated at a constant current
density was recorded by using Impedance/Gain-Phase
Analyzer (Auto Lab). The anode was fed with ethanol
solution as working electrode (WE) and the cathode was
fed with hydrogen as a DHE.
R
ESULTS AND
D
ISCUSSIONS
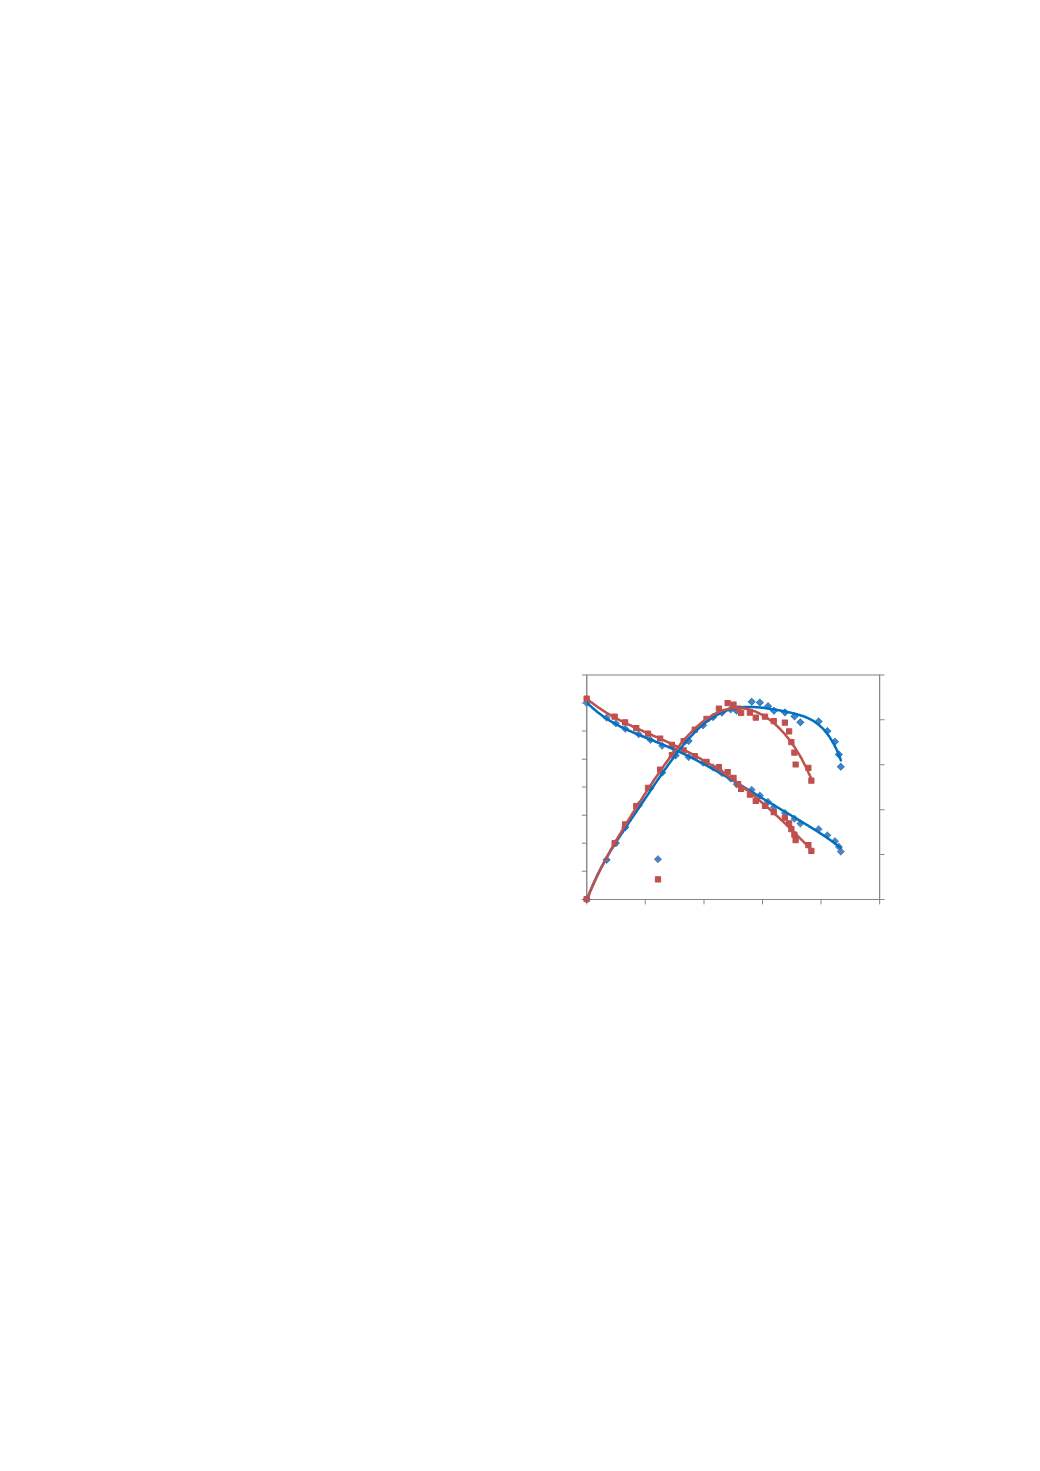
Polarizationandpower curves of different MEAs are
shown in Fig. 1. The result shows that at low current
region, both MEAs yield almost similar cell performance,
whereas, at higher current densities, MEA without anode
MPL has higher current densities at the same voltage
comparing to MEA with anode MPL. The power density
peaks for the MEAs without and with anode MPL are
21.99 and 21.83 mW/cm
2
, respectively. The maximum
power density of the MEA without anode MPL is slightly
higher than that of MEA with anode MPL. Obviously,
MEAhaving anode MPL show strongly further reduced
performance at high current densities. It is expected that
the existing of anode MPL wouldincrease the mass-
transfer resistance of ethanol solution from the anode
flow channel to the anode CL. This situation leads to an
inadequate ethanol concentration in the anode CL.
Fig. 1. DEFC polarization and power density curves of MEAs with and
without anode MPL.
Constant-current discharge of these MEAs was
performed for 1800 s. DEFC voltage variations over
discharge time at 30 mA/cm
2
are recorded and presented
in Fig. 2. The average cell voltage during a constant
current discharge is 0.502 V for MEA without anode
MPL, higher than 0.439 V of MEA with anode MPL. The
MEA without anode MPL yields higher current densities
over discharge time. This confirms the effect of anode
MPL acting as a barrier to prevent the ethanol for the
flow channel to anode CL. Furthermore, the voltage
decay behavior is quite different at the beginning of the
current discharging step change. This can be explained
that the mass transport affected by the presence of anode
MPL also had significant on impact the cell performance.
It is believed that not only the prevention of ethanol
solution to enter the anode CL, but also CO
2
0
5
10
15
20
25
0
0.1
0.2
0.3
0.4
0.5
0.6
0.7
0.8
0
20
40
60
80 100
Power density (mW/cm
2
)
Cell voltage (V)
Current density (mA/cm
2
)
without anode MPL
with anode MPL
2013 International Conference on Alternative Energy in Developing Countries and Emerging Economies
- 704 -


