middle lamella and the outer layer of the fiber
cell wall, i.e. the primary wall. The lignin is
chiefly found in the middle lamella (Gram,
1983).
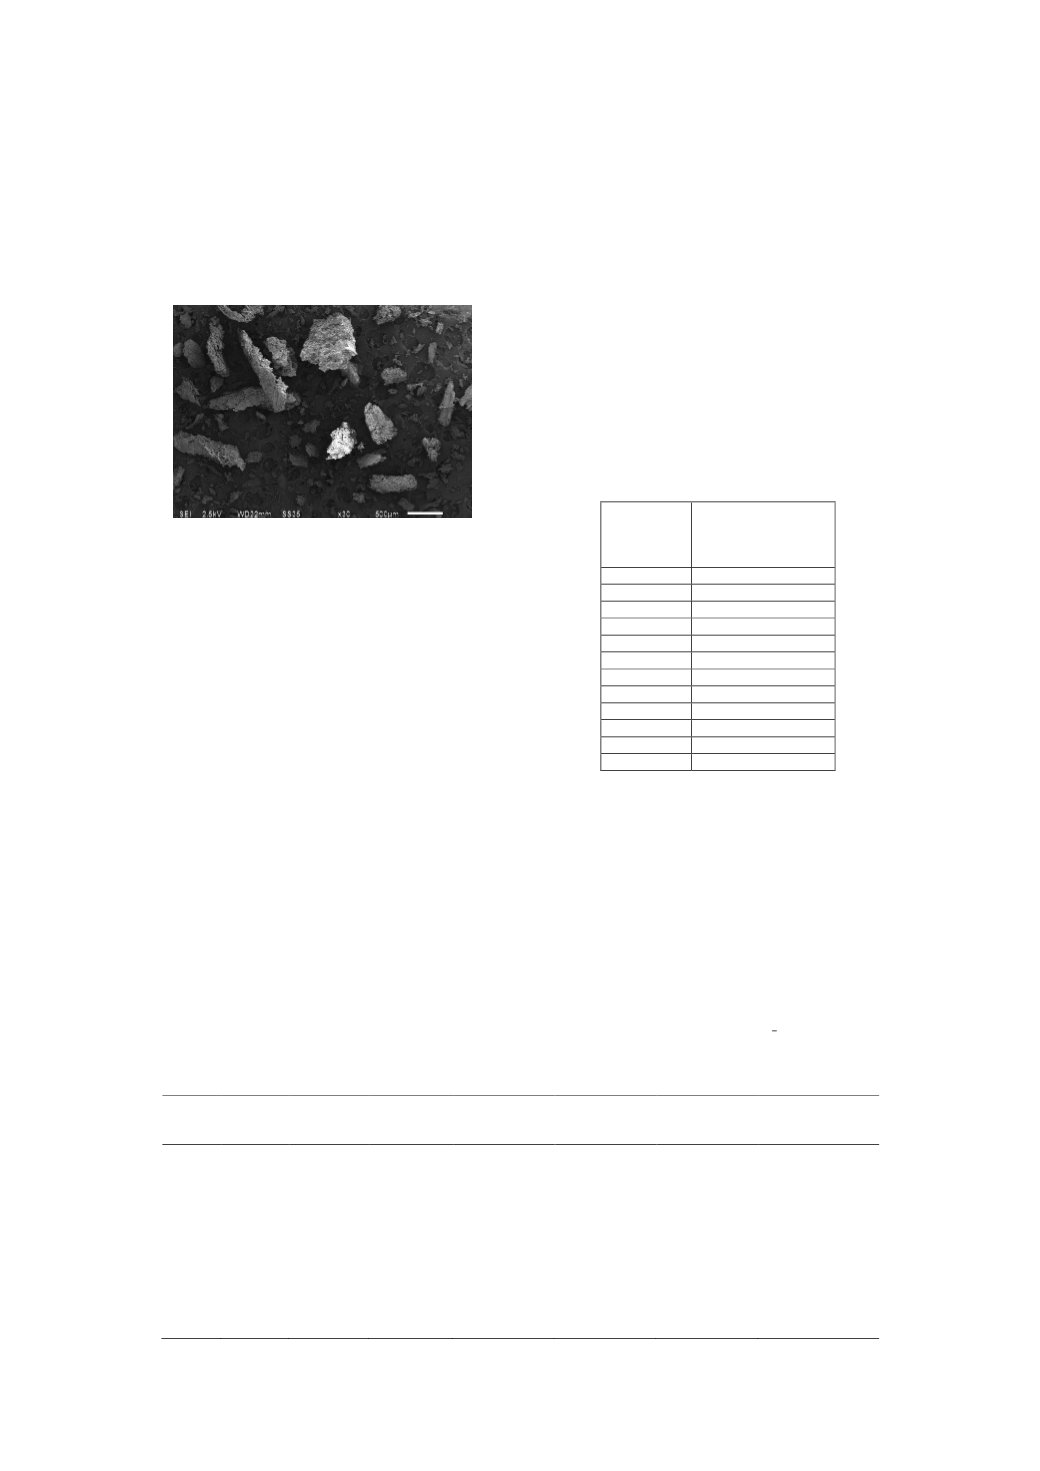
The electron micrograph of durian peel
powder is shown in Fig. 3. As seen, the durian
peel powder is not spherical but has irregular
shapes and large surface areas.
Fig. 3. SEM observation of the durian peel powder
(Magnified 30 X).
D. Raw Material Preparation
Durian peel powder was made as follows;
the first step was to reduce the fresh durian
peel to approximately chip size. The chip size
pieces were oven-dried at 80 ºC for 8 h. Dried
durian peel chips were hammermilled. Durian
peel powder for being natural adhesives were
screened by sieved over 80-100 mesh screen.
Then, fibers were screen to remove excess
fines by sieve machine over a 60 mesh screen.
E. Boards Preparation and Testing
The procedure for preparing specimens was
done as follows; weighing durian peel powder
and fiber sample according to the desired ratio
as shown in Table 3. Add exact volume of
water and mix well. The blended particles were
felted by hand into the final mat with a
forming box (250 mm x 250 mm). The formed
particlemat were pressed at a platen
temperature of 150 ºC. A pressure of 1000 and
1500 Psi was applied for the boards. After the
hot pressing, the boards were drying at
temperature of 80, 90 and 100
C in order to be
completely cured for 24 h and the trimmed and
cut into various test specimens. Afterwards,
testing specimens were carried out for physical
and thermal properties. Testing specimens
were carried out according to JIS A 5908-2003
(Japanese Standard Associating, 2003) for
physical properties; density, moisture content,
thickness swelling. The Thermal conductivity
of the particleboards was measured by using a
thermal conductivity analyzer NETZSCH
Model HFM 436 Lamda according to ASTM C
518 (American Society for testing and
Materials).
TABLE III
MIXING RATIO (FIBER: POWDER: WATER)
AND DRYING TEMPERATURE
Board
Mixing Ratio
(Fiber:Powder:Water)
and Drying
Temperature
1
1:1:1
(80 ºC)
2
1:1:1.5 (80 ºC)
3
2:1:1.5 (80 ºC)
4
2:1:2
(80 ºC)
5
1:1:1
(90 ºC)
6
1:1:1.5 (90 ºC)
7
2:1:1.5 (90 ºC)
8
2:1:2
(90 ºC)
9
1:1:1 (100 ºC)
10
1:1:1.5 (100 ºC)
11
2:1:1.5 (100 ºC)
12
2:1:2 (100 ºC)
R
ESULTS AND DISCUSSION
A. The Physical, Mechanical and Thermal
Properties
The Physical Mechanical and thermal
properties is shown in Table IV. It was found
that the optimum mixing ratio (durian fiber:
durian powder: water) was 2:1:1.5 drying at
100 ºC that the particleboard have the best
physical properties, mechanical properties and
the lowest thermal conductivity.
TABLE IV
PHYSICAL AND THERMAL PROPERTIES OF PARTICLEBOARDS [3,4]
Board
Density
(g/cm
3
)
Moisture
Content
(%)
Thickness
Swelling
(%)
Thermal
Conductivity
(W/m.K)
Internal Bond
(MPa)
Modulus of
Rupture
(MPa)
Modulus of
Elasticity
(MPa)
1
0.76
19.96
70
0.110
0.06531
1.283
127.204
2
0.80
19.68
60
0.137
0.08626
0.825
82.544
3
0.80
14.88
60
0.141
0.06104
1.138
102.866
4
0.87
18.87
50
0.137
0.01330
0.593
46.022
5
0.77
12.5
60
0.101
0.01347
0.969
91.716
6
0.80
17.81
50
0.117
0.02160
0.888
73.995
7
0.80
10.03
50
0.119
0.02765
0.773
71.758
8
0.75
13.36
50
0.088
0.01980
0.766
77.711
9
0.80
8.39
40
0.084
0.06080
0.906
90.420
10
0.82
10.75
30
0.100
0.03128
0.665
55.756
11
0.82
8.809
30
0.109
0.04739
1.648
132.790
12
0.80
10.34
30
0.081
0.02877
0.481
43.360
2013 International Conference on Alternative Energy in Developing Countries and Emerging Economies
- 722 -


