2011 International Conference on Alternative Energy in Developing Countries and Emerging Economies
- 138 -
has become an important consideration for this
processing operation. In this respect, drying energy and
operating period are the parameters to be minimized.
Consequently, the development of a mathematical drying
model should be investigated, because it can be used for
predicting the evolution of moisture transfer and energy
consumption of the drying system. Knowledge of the
mathematical simulation of drying is necessary to be used
for studying the drying operation and to predict evolution
of moisture transfer including energy consumption of the
drying system. However, there have been very few
studies relating skim rubber drying and its production
process, so the design of this drying system has become
an important consideration for this processing operation.
Therefore, the objectives of this research are to
development mathematical drying model of a fixed-bed
dryer and to simulate SR drying. In order to evaluate the
validity of this simulation, several tests were conducted in
a laboratory scale SR dryer under different drying
conditions with two independent drying variables,
namely, drying air temperature and specific air flow rate
of SR on specific energy consumption and drying time.
Development of the mathematical model for prediction of
the SR drying process were conducted and used for
prediction of the suitable condition.
III. MATERIAL AND METHOD
A.
Material and equipment
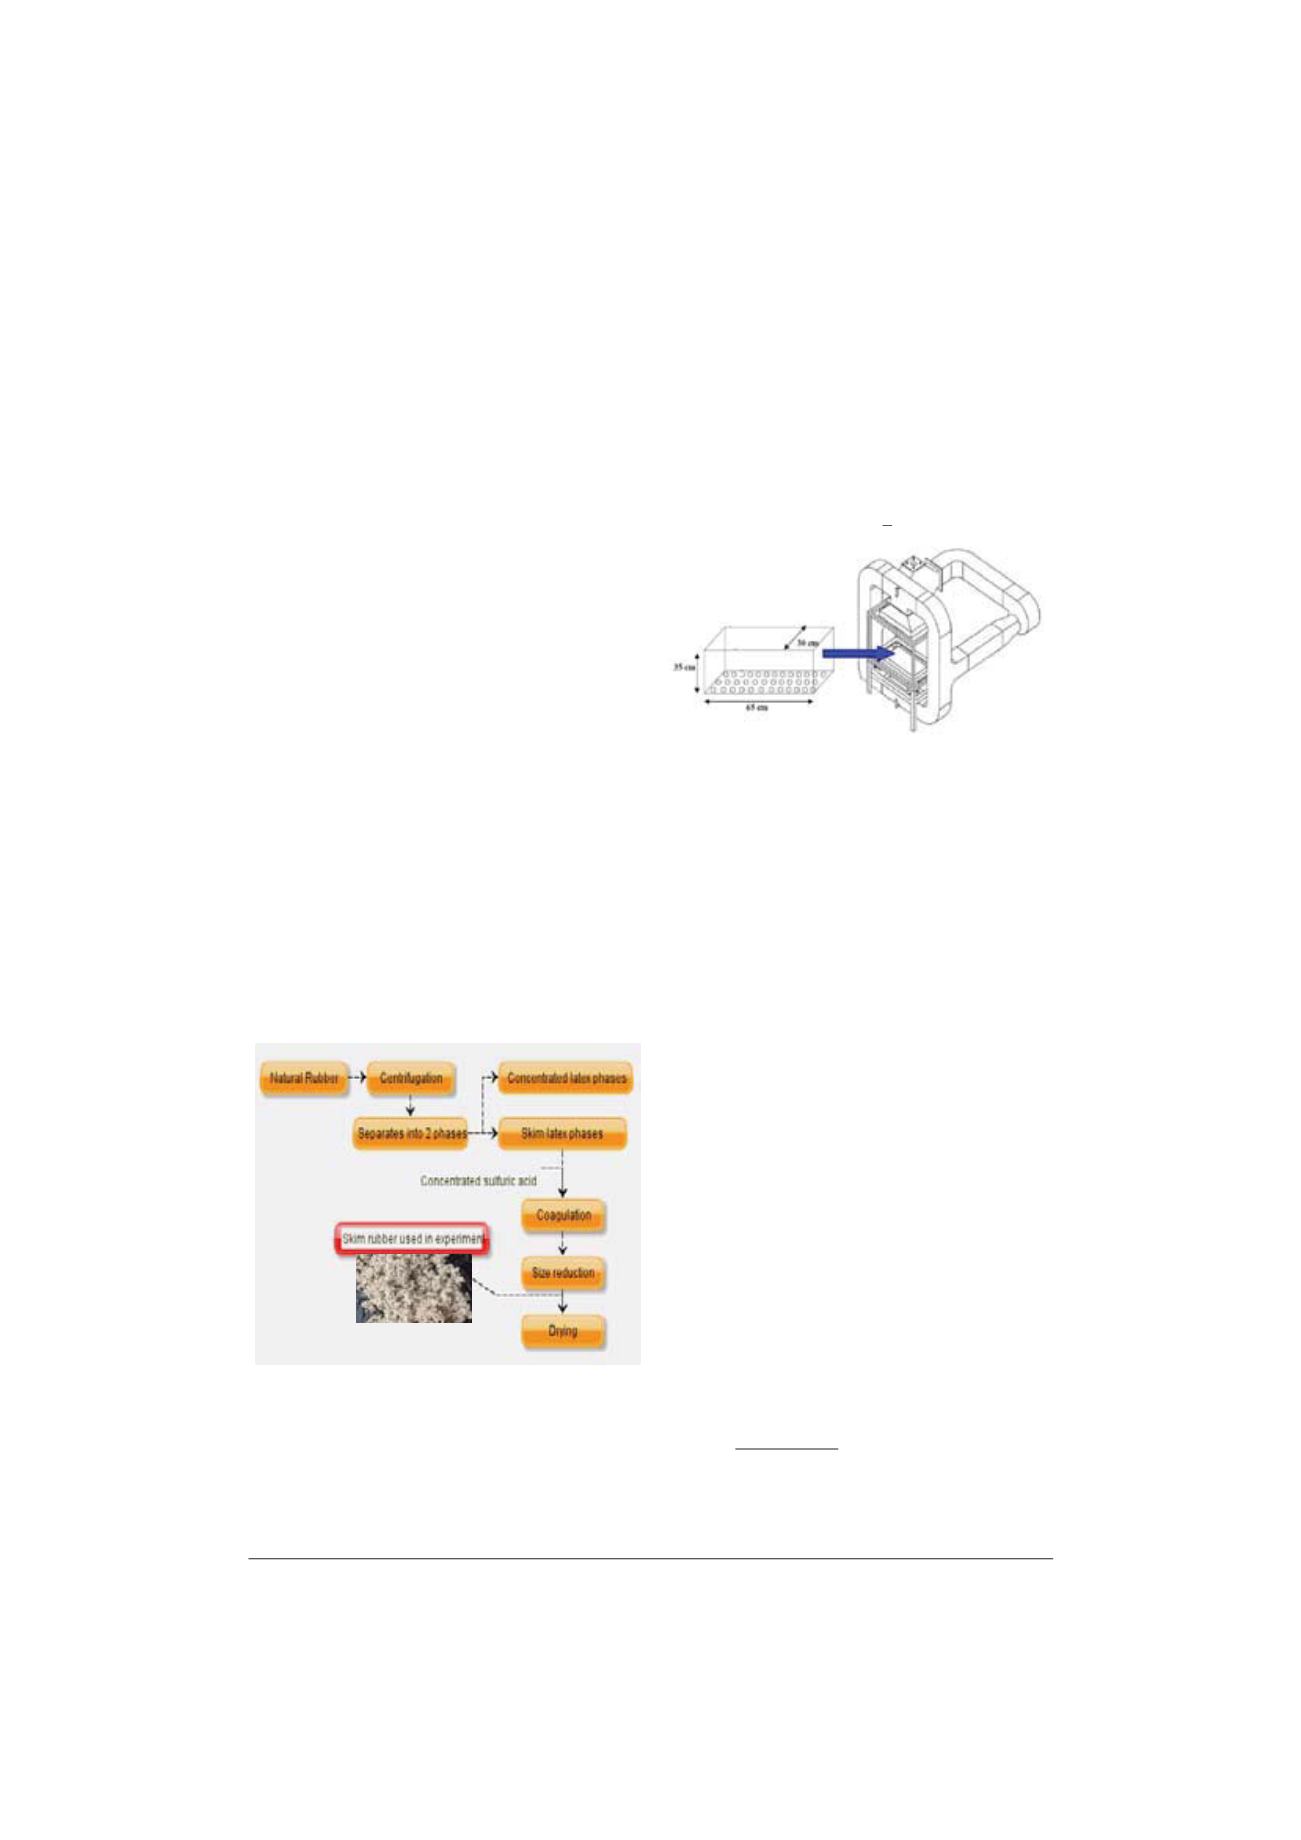
Skim rubbers (SR) used in the experiment was
provided from B TECH Industry Co., Ltd., Songkhla
province, Thailand. Through several processes such as
neutralization and coagulation, size reduction, drying and
packing as shown in Fig 1. Moisture content was
determined under ASABE standards (ASABE Standards,
1988). The SR samples were then placed in an incubator
at constant temperature of 130
q
C for 3 hours.
Fig.1. The manufacture steps of Skim rubber used in experimental.
An experimental fixed-bed dryer used in this study
was shown in Fig. 2. The main system comprised a fixed-
bed dryer with dimensions of 0.35 x 0.70 x 0.80 m
3
. The
dryer consisted of the electric heater unit of 2.4 kW, a
centrifugal fan driven using 2.0 hp motor and temperature
controller unit. The drying air temperature was controlled
by a PID controller giving an accuracy of
r
0.1
q
C.
Besides, a mechanical variable speed unit could regulate
precisely airflow rate. Air velocity was measured by hot
wire anemometer with an accuracy of ±0.1 m/s. The inlet
and outlet drying air temperature, ambient air temperature
and the grain temperature in each rubber bed depth were
measured using a K-type thermocouple connected to a
data logger with an accuracy of +1
q
C.
Fig.2. Schematic diagram of a fixed-bed dryer.
B.
Equilibrium moisture content (EMC)
Equilibrium moisture content (EMC) was determined
using the gravimetric method (Wang & Brennan, 1991).
Five saturated salt solutions for achieving an EMC stage
used in this experiments such as KNO
3
, NaCl,
Mg(NO
3
)
2
•6H
2
O, MgCl
2
•6H
2
O and LiCl. All of the
saturated salt solutions provide relative humidity
surrounding of 10-90%. During experiments, the block
rubber samples and saturated salt solutions were put in
the airtight vials. The vials was placed into incubator at
controlled temperatures of 40-60
q
C to obtain dry matter
weight. After a few week, sample was in an equilibrial
state with the saturated salt solution. This state was
acknowledged when three consecutive weight
measurements showing a difference lower than 0.001 g.
Then the sample was taken to determine moisture content
followed by ASABE method (ASABE Standards, 1988).
The sample was taken by means of triplication.
Four isotherm models for predicting EMC were
chosen to correlate the experimental data, the surrounding
temperature and the relative humidity (RH). Formulated
functions of relative humidity, temperature and EMC
conditions are shown in Table I. Constants in these
models were derived from non-linear regression analysis
on the experimental data.
Values of constants in these models were estimated
by non-linear regression analysis from the experimental
data. Suitability of equations was evaluated and
compared using coefficient of determination (R
2
), root
mean square error (RMSE) and standard error of estimate
(SEE), which indicate the fitting ability of a model to a
data set for selecting the best equation to describe the
experimental data. Following equations were written:
ʹ
ൌ ͳ െ
σ ሺ
െ
ሻ
ʹ
ൌͳ
σ ሺ
െ ഥ
ሻ
ʹ
ൌͳ
(1)


