2011 International Conference on Alternative Energy in Developing Countries and Emerging Economies
- 247 -
0
100
200
300
400
500
600
700
Jan Feb Mar AprMay Jun Jul Aug Sep Oct NovDec
Month
Power (W)
300
350
400
450
500
550
600
Global Radiation (W/m
2
)
Power a-Si Solar Cell
Global Radiation
Average Power a-Si Solar Cell
Average Global Radiation
0
1
2
3
4
5
6
7
Jan Feb Mar Apr May Jun Jul Aug Sep Oct Nov Dec
Month
Efficiency (%)
Average
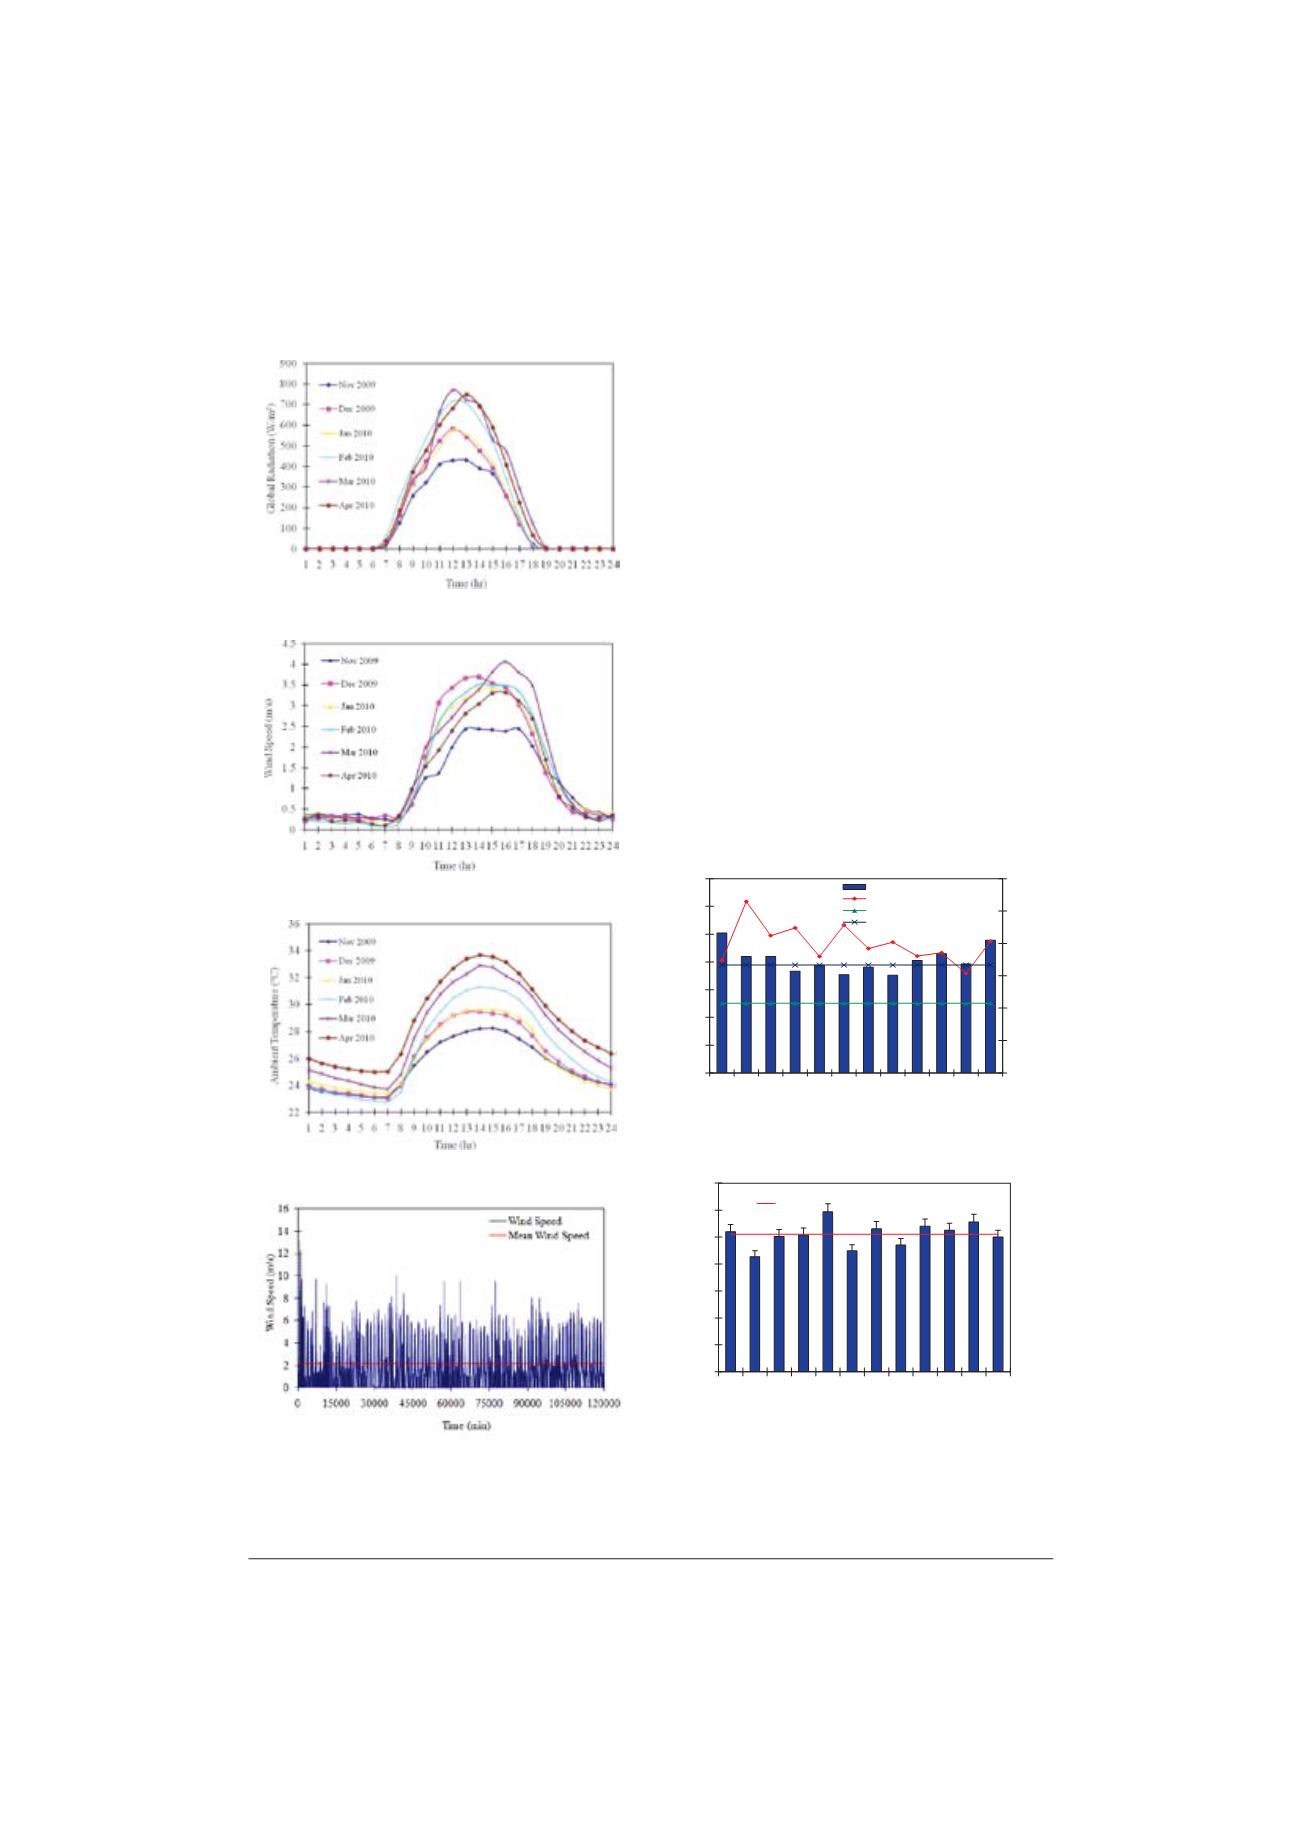
Fig. 3. The variation of hourly global solar radiation intensity in
Phatthalung province during November 2009 until April 2010.
Fig. 4. The variation of hourly wind speed in Phatthalung province,
southern Thailand during November 2009 until April 2010.
Fig. 5. The variation of hourly ambient temperature in Phatthalung
province, southern Thailand during November 2009 until April 2010.
Fig. 6. Time series of 1-min wind speed at 15 m during November 2009
until April 2010.
Fig. 7 showed the simulated results of the variation of
monthly and yearly average of global solar radiation and
power produced by a a-Si PV generator under ambient
condition of Phatthalung province, southern Thailand. It
is obvious that the more global solar radiation intensity
the higher power produced by a-Si PV generator occurred
during summer month starting from December 2009 until
February 2010. The maximum global solar radiation was
620 W/m
2
in February 2010 whereas the maximum
power produced by a-Si PV generator was 510 W in
January 2010. The yearly average global solar radiation
intensity was 390 W/m
2
while the yearly average power
produced by a-Si PV generator was 255 W. The variation
of monthly efficiency of a-Si PV generator was shown in
Fig. 8. The monthly average efficiency of a-Si PV
generator was in the range of 4.4-6% under ambient
condition of Phatthalung province, southern Thailand.
The maximum efficiency of a-Si PV generator was 6% in
May 2010. The yearly average of efficiency of a-Si PV
generator was 5.2% as shown in Fig. 8. Fig. 9 shows the
relation between observable global solar radiation and
calculate deficiency of a-Si PV generator. It is obvious
that the efficiency of a-Si decreased when the global solar
radiation intensity increased. The higher efficiency of a-
Si PV generator occurred during the low intensity of
global solar radiation. This is due to the characteristic and
the limitation of a-Si PV generator.
Fig. 7. The variation of monthly and yearly average global solar
radiation intensity and power produced by a PV generator.
Fig. 8. The variation of monthly and yearly average efficiency of a-Si
PV generator.


