2011 International Conference on Alternative Energy in Developing Countries and Emerging Economies
- 313 -
kinetic energy,
k,
and a mixing length approach for the
diffusivity calculated from atmospheric conditions.
The turbulence kinetic energy is then given by:
»
»
¼
º
«
«
¬
ª
w
w
¸¸
¹
·
¨¨
©
§
w
w
w
w
j
k
T
j
k
j
j
x
k
x
P
x
k U
V
Q
H
(1)
Where:
j
j
i
j
j
i
T k
x
U
x
U
x
U P
w
w
¸
¸
¹
·
¨
¨
©
§
w
w
w
w
Q
T
T
Lk
2/1
Q
The dissipation is given by:
k
L
C
T
T
2
Q
H
P
The length scales of turbulence L
T
, as well as the C
μ
coefficient, are depending on atmospheric stability
through the Richardson Flux number
R
if
as follow:
°
°
°
¯
°
°
°
®
°
¯
°
®
t
¸¸
¹
·
¨¨
©
§
16,0
, 085 ,0
16,0
,
)
2231 ,0)(
1(
)
2341 ,0)(
1912 ,0(
96,1
, 1 1 1
2
0
23
if
if
if
if
if
if
m
m
T
Rsi
Rif
R
R
R
R
S
height
z
where
z
l
l
l S
L
N
(2)
1
4
B
S C
m
P
The near neutral stability class was used for
computations. Moreover, perturbations induced by
forests, which generate a high level of turbulences and
strong wind shears, have been modeled by including sink
terms in the momentum conservation equations, and
turbulence production in the turbulent kinetic energy
equation, for the cells lying inside the forested areas [2].
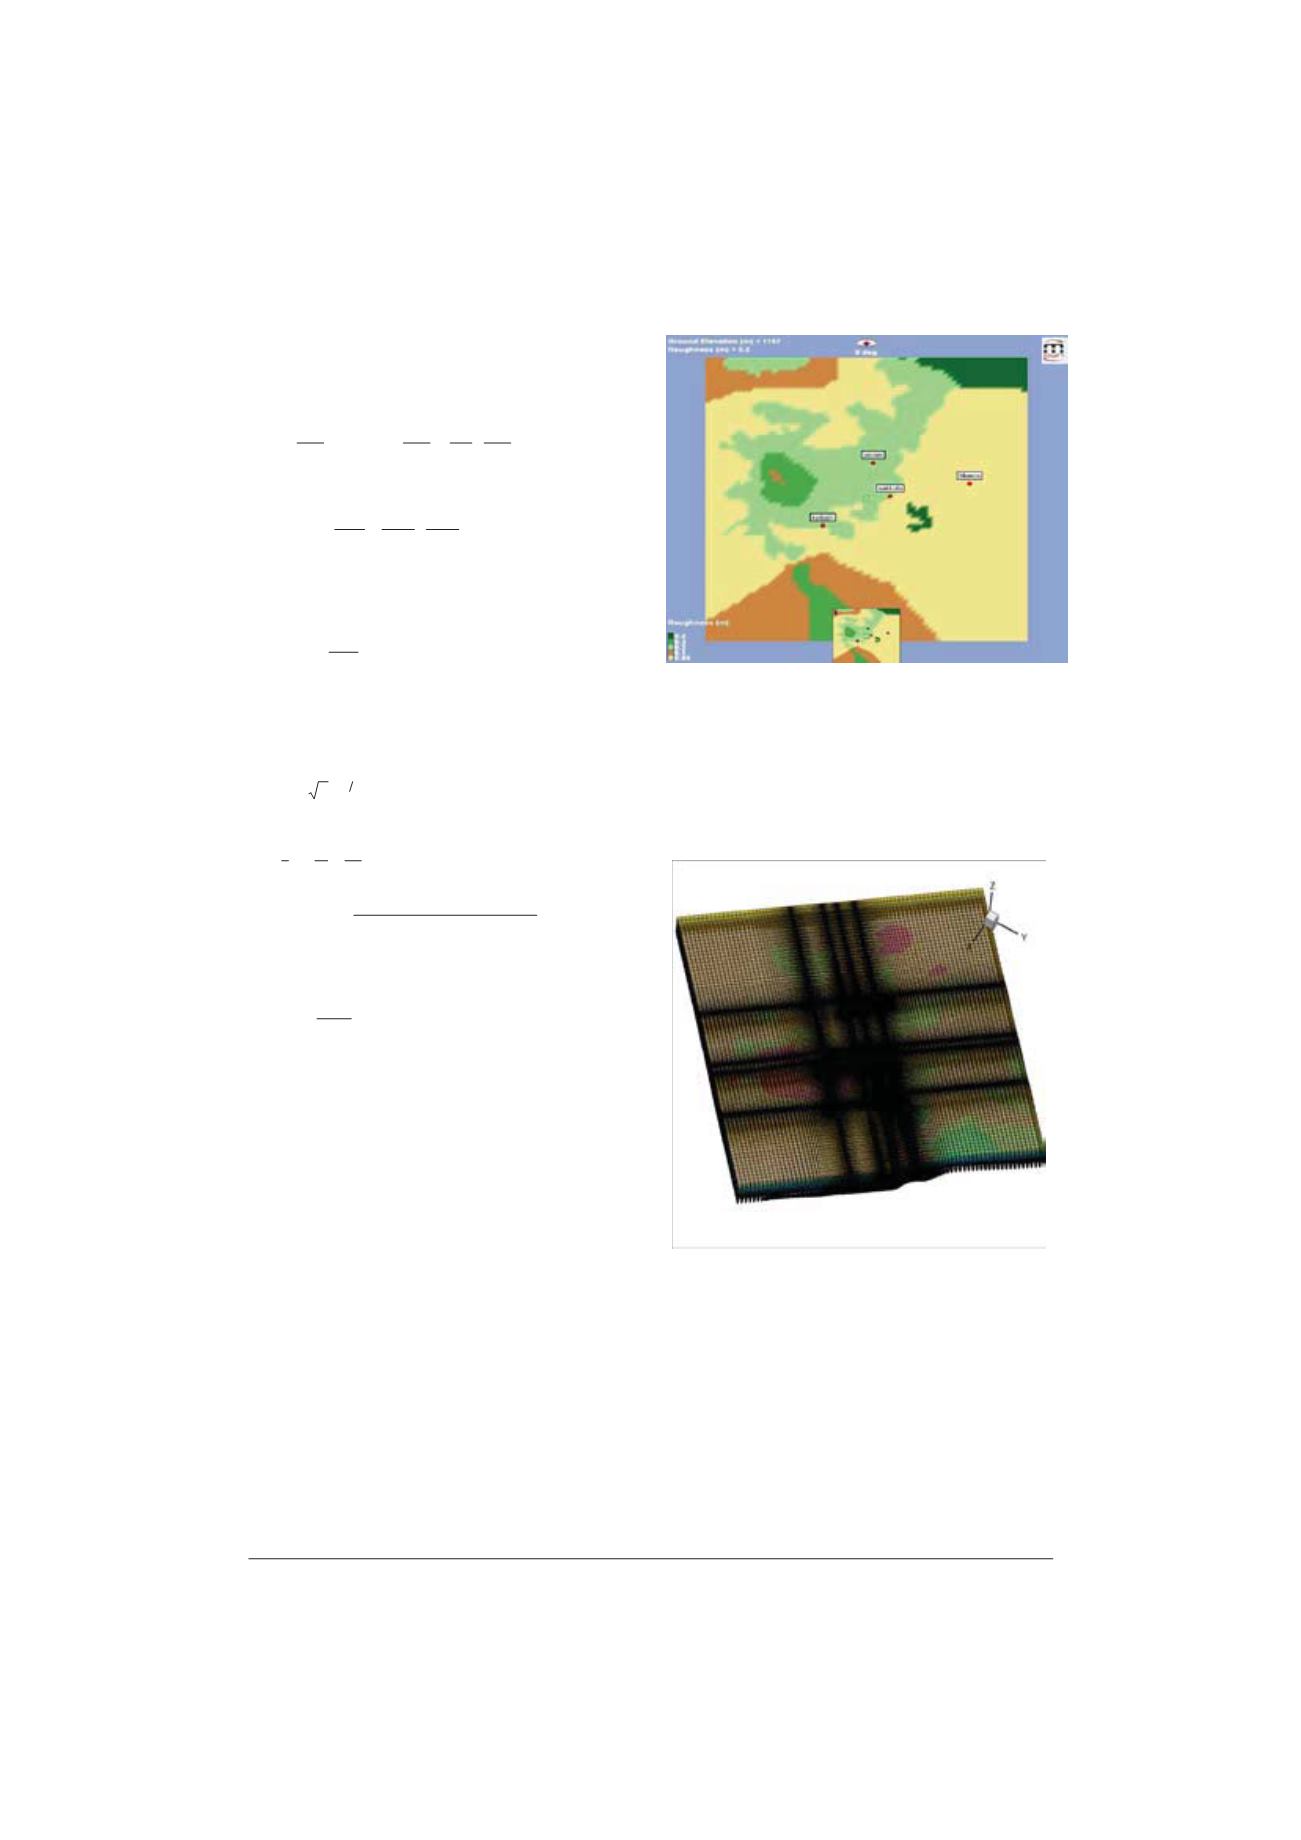
Roughness contours have been generated thanks to
satellite photography and observation during the site visit.
The default roughness (yellow color in the picture) is
equal to 0.05 meters. The roughness length attributed to
the forest area has been evaluated thanks to the mean
height of the trees which was observed during the site
visit. It is equal to 0.3 meters, which refers to 9 meters
high trees for the light green roughness and 0.4 which
refers to 12 meters light trees for the dark green
roughness.
Fig. 5. Roughness map.
IV. D
IRECTIONAL
R
ESULTS
The fine resolution has permitted to compute the flows
over this kind of terrain accurately, by taking into
consideration the recirculation zones and the flow
detachments due to strong slope variations.
Fig. 6. Grid refinement towards the results points.
A comparison between the measured wind profiles and
the computed profiles show that the near neutral stability,
used by default in the software, are particularly well
reproducing the measured wind profiles in the main wind
directions.


