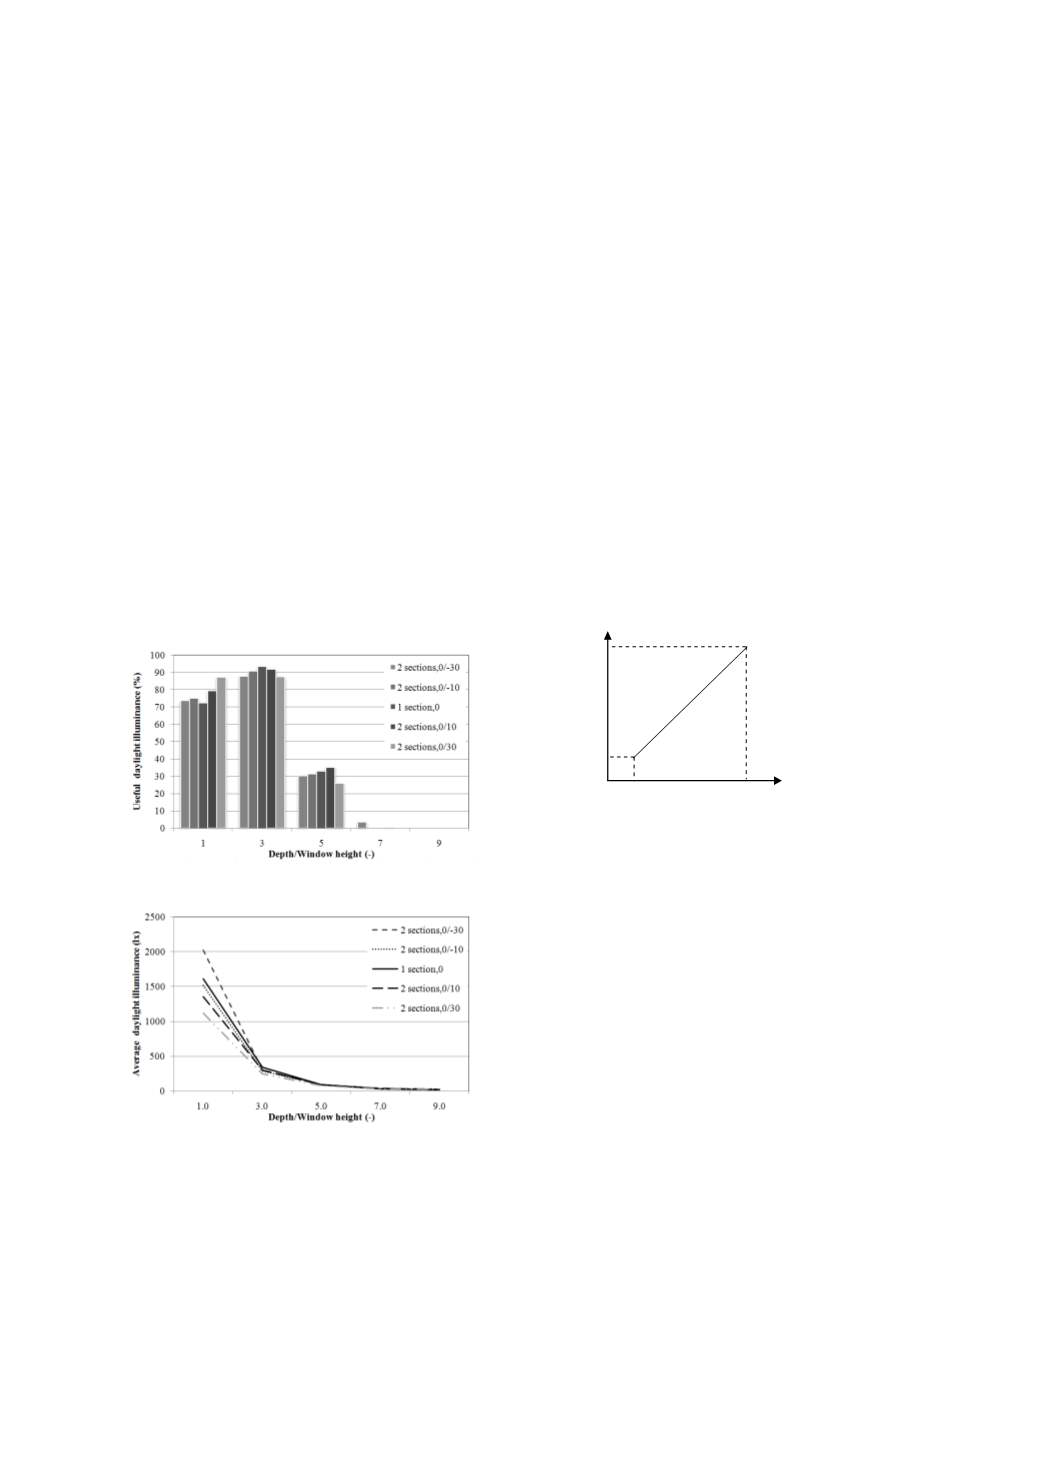
the area (D/H=1). At D/H=3, the single-section slat
window give a highest UDI value of 92% but not differs
much from those of the two-section slat window. At
D/H=5 and 7, the two-section slat windows give better
UDI values.
Examine again Fig. 5(b), the two-section slat window
influence mainly the daylight near the window by either
increasing or decreasing the daylight illuminance. It does
not influence much the daylight in deeper area. From the
figure, the daylight has no potential in the area deep from
70%D (seven times of the window height).
Figure 6 exhibits similar plots to those in Fig. 5 but
for the lower-to-upper slat section proportion of 50:50.
The plots show that proportion of the slat section
influence on the interior daylight level but in both
positive and negative manners. From Fig. 6(a), UDI
values of two-section slat window at D/H=1 are now
higher than that of one-section slat window. This is
because this slat section proportion reduces the excessive
daylight illuminance in the area (D/H=1) (See Fig. 6(b)).
However, the lower daylight illuminance from the two-
section slat window also lead to lower UDI values in
deeper areas (D/H=3 and 5). From Fig. 6(b), it should be
noticed that uniformity of the daylight distribution can be
improved by the two-section slat window.
(a) UDI of the 50:50 slat window
(b) ADI of the 50:50 slat window
Fig. 6. Daylighting performance of the 50:50 two-section slat window
Among all of the cases made in the simulation, the
maximum average UDI from the five points is of the
section ratio of 50:50 and the tilted slat angle in lower
and upper section of 0
and 10
.
B. Energy Saving
In this section, the energy savings from electric
lighting is evaluated for the room model. It is assumed
that the light luminaires on the room ceiling provided
uniformly a target illuminance on workplane level (0.75
m. above floor) regardless of daylight. Each luminaire
was housed with two T8 fluorescent lamps (36W) and
one electronic ballast (2W). One lamp produced the light
flux of 2,680 lumens. By Lumen method calculation and
a Coefficient of Utilization value (
CU
) of 0.50 for typical
lighting design, the light power densities (
LPD
) of
lighting to provide the illuminance at 500 lux were
calculated at 17.5W/m
2
. For the base case, all the lamps
were fully turned on during typical office hours 8:00-
17:00 for five days a week (Monday-Friday).
A dimming controller was integrated with the lighting
system to regulate the light from lamps to supplement the
daylight from the slat window. The lighting system
however consumed electric power at 10% of its rated
even when the daylight alone could illuminate the space
at target illumination level or excess. Figure 7 exhibits
power consumption of dimmable lighting system for the
workplane illuminance of 500 lux.
Fig. 7. Power consumption of the dimmable lighting system to provide
the workplane illuminance of 500 lux
Table 3 exhibits the average UDI and ADI values of
the 50:50 two-section slat window and the corresponding
reduced LPD values of the dimmable lighting system
including the savings. From the table, it is assumed that
the tilted angle of the slats in the upper and the lower
sections are altered to the best position to achieve the
maximum electrical energy savings in each calendar
month.
LPD (W/m
2
)
Illuminance by lamps
(Lux)
500
50
17.5
1.8
2013 International Conference on Alternative Energy in Developing Countries and Emerging Economies
- 594 -


