2011 International Conference on Alternative Energy in Developing Countries and Emerging Economies
- 123 -
the oxidation on the particle. The atomizing chamber is
divided by two sides, a glass chamber at the upper side
and zinc chamber at the bottom side.
The lower part of the atomizer involves an air cleaner
and powder collector.
3. EXPERIMENTAL DESIGN PROCEDURE
3.1. Experimental procedure
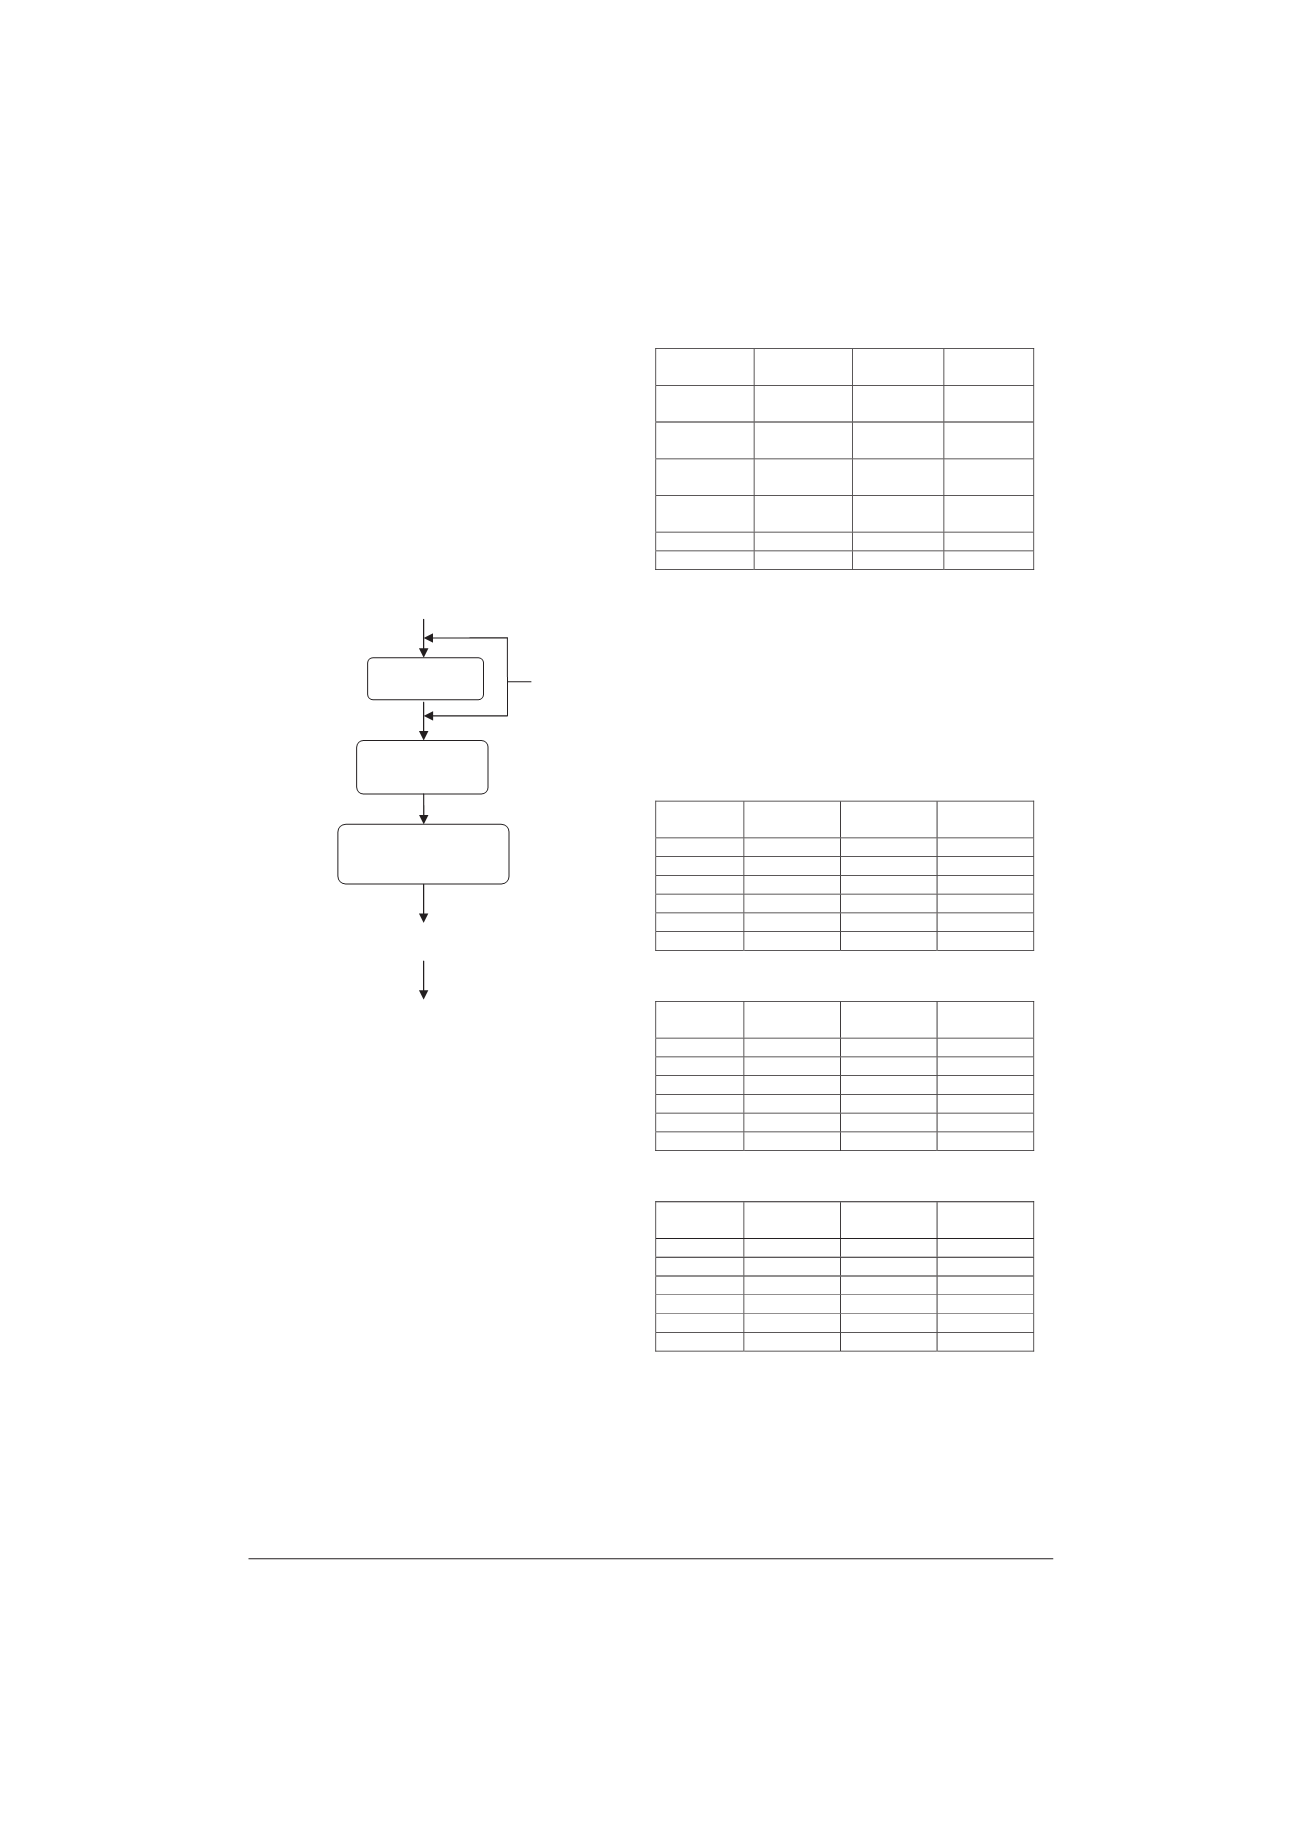
Experimental procedure of aluminum powder is shown
in Fig. 3. Twenty grams of aluminum metal wire was
weighed and placed in a crucible. Then, the crucible was
placed into the furnace and heated for 30 min at 710ºC.
Fig.3. Schematic diagram of hybrid atomization
The melt is atomized by a gas atomizer into coarse
liquid droplets. After that, the thin liquid film was
centrifuged at 23000 rpm. The solidified powders are
collected by a powder collector. The sample was weighed
for particle size distribution analysis. A sample of weight
is passed through a set of known mesh sizes (Retsch- AS
200 basic). The powder was weight and analyzed by
scanning electron microscope (SEM).
3.2. Experimental parameter
Hybrid atomization was carried out for aluminum
metal with variable ranges of main parameters as gas
pressure: 0.5, 0.6, and 0.7 MPa. Other parameters are disk
diameter: 100mm, spray distance: 100mm, rotational
speed: 23000rpm and melting temperature: 710ºC which
are kept constant in this study. Operational parameters of
experiments are shown in Table 4.
Table 4.
Experimental parameters
Experiment
1
Experiment
2
Experiment
3
Weight of
sample
20 g
20g
20g
Disk
diameter
100mm
100mm
100mm
Spray
distance
100mm
100mm
100mm
Rotational
speed
23000rpm
23000rpm
23000rpm
Temperature 710ºC
710ºC
710ºC
Gas pressure 0.5 MPa
0.6 MPa
0.7 MPa
4. EXPERIMENTAL DESIGN PROCEDURE
4.1. Particle size distribution of aluminum powder
According to the experimental parameters, the data of
particle size distribution, established by mechanical
sieving, is given in Tables 5, 6 and 7. The result of particle
size distribution is shown in Fig 4. The size distribution is
also described by the cumulative fraction as shown in Fig.
5.
Table 5.
Particle size distribution of experimental
conditions gas pressure of 0.5MPa
Size (μm)
Mass (g)
Fraction
Cumulative
fraction
300
2.29
0.123
0.123
212
2.608
0.1406
0.2636
150
2.574
0.1388
0.4024
106
1.994
0.107
0.5094
75
4.944
0.266
0.7754
<75
4.133
0.222
0.9974
Table 6.
Particle size distribution of experimental
conditions gas pressure of 0.6MPa
Size (μm)
Mass (g)
Fraction
Cumulative
fraction
300
2.466
0.1329
0.1329
212
1.4141
0.0762
0.2091
150
1.439
0.0775
0.2866
106
1.3778
0.0742
0.3608
75
6.441
0.3473
0.7081
<75
5.406
0.2915
0.9996
Table 7.
Particle size distribution of experimental
conditions gas pressure of 0.7MPa
Size (μm)
Mass (g)
Fraction
Cumulative
fraction
300
2.3821
0.1284
0.1284
212
2.2051
0.1189
0.2473
150
1.8085
0.0975
0.3448
106
1.1169
0.0602
0.405
75
2.1339
0.1139
0.5189
<75
8.9186
0.4809
0.9998
The experiments were conducted under three gas
pressure (0.5, 0.6, 0.7 MPa). For the particle size less than
Nitrogen
Gas
Aluminum metal
i
Melting Unit
Gas
Atomization
Centrifugal
Atomization
Powder Collector
Fine Powder


