2011 International Conference on Alternative Energy in Developing Countries and Emerging Economies
- 177 -
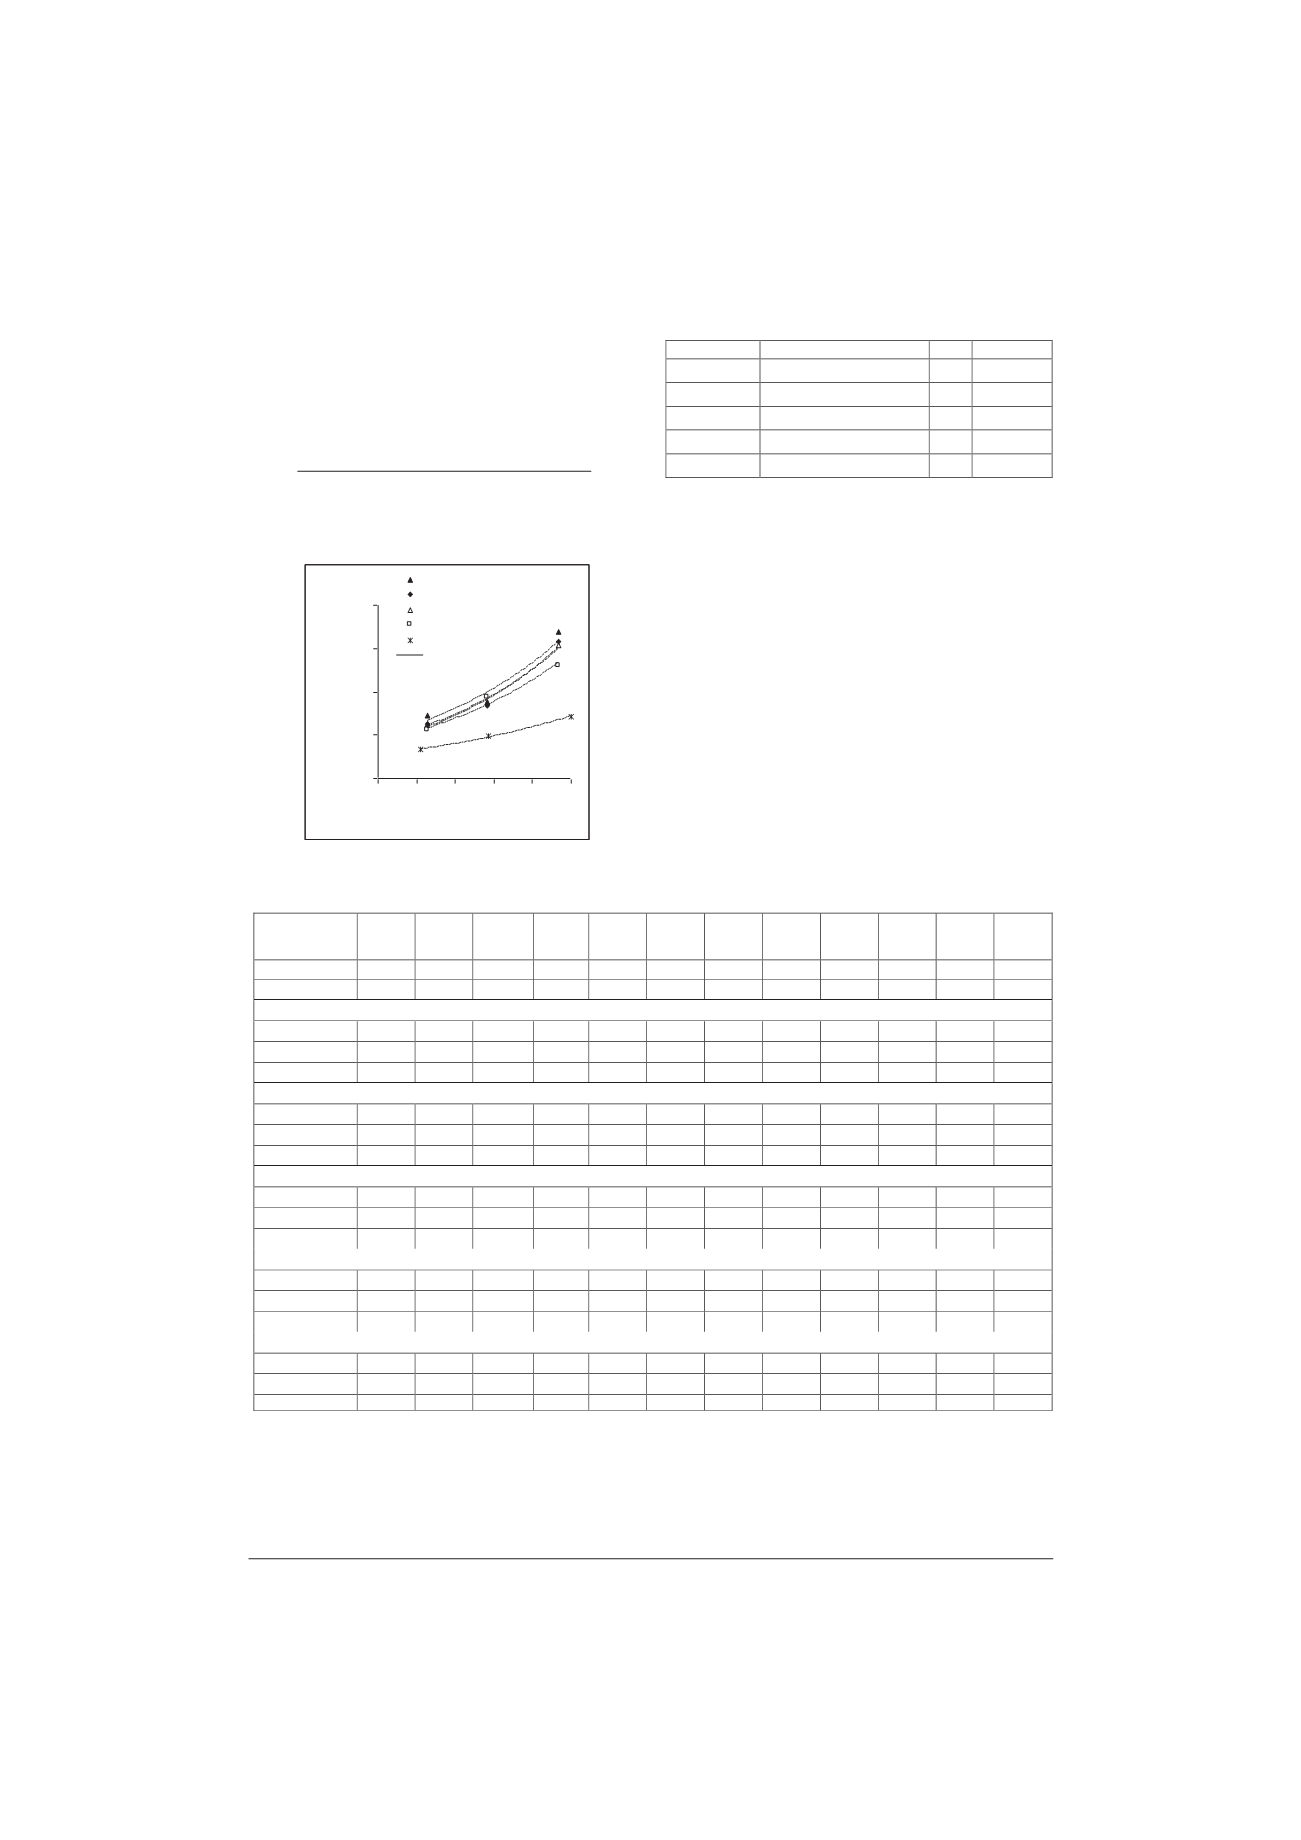
Fig. 2. Effective diffusion coefficients of different drying strategies.
0
1
2
3
4
50 60 70 80 90 100
Drying Temperature (°C)
Diffusion coefficient,x10
-9
(m
2
/s)
IR 1500 W
IR 1000 W
HA+IR 1500 W
HA+IR 1000 W
HA
model
TABLE
III
Q
UALITIES OF DRIED PARBOILED RICE
Drying
temperature (°C)
Drying
time (min)
Drying
rate
(kg/hr)
IMC
(FMC)
(%d.b.)*
W
b* value HRY (%)
AS
ns
GC (mm) Water
absorption
LC (%)
ns
PC
(%)
ns
AMC
(%)
ns
Control rice
-
-
55.7(16.1) 24.8
18.7
73.6
3.3
98.5
1.47
1.4
6.00
23.35
Reference rice
-
-
16.0(16.0) 54.7
12.3
50.0
4.8
100.0
1.65
1.1
5.55
25.18
HA+IR 1500W
60.0
48
0.15 54.0(22.0) 23.3
c
18.7
a
70.6
a
3.3
95.0
c
1.34
ab
1.3
6.12
22.41
78.1
27
0.24 54.0(22.4) 21.2
b
18.8
b
67.0
a
4.0
92.1
b
1.53
b
1.2
6.07
23.73
98.8
21
0.35 54.0(22.4) 20.0
a
19.0
b
70.0
a
3.0
87.3
a
1.11
a
1.4
6.33
23.50
HA+IR 1000W
61.3
54
0.11
54.0(21.5) 23.2
c
18.5
a
68.6
a
3.0
98.5
c
1.21
a
1.3
6.10
22.87
84.3
30
0.21 54.0(22.3) 20.5
b
19.1
b
70.4
b
3.5
94.6
b
1.24
ab
1.5
5.87
23.53
99.7
24
0.26 54.0(23.1) 19.4
a
19.2
b
70.6
b
3.3
86.1
a
1.08
a
1.1
6.17
23.68
IR 1500W
62.9
43
0.12 54.0(23.1) 21.3
c
18.9
a
67.5
a
3.8
97.3
b
1.49
a
1.3
5.98
24.12
78.4
27
0.24 54.0(23.1) 19.0
b
18.8
a
67.3
a
3.6
98.0
b
1.64
b
1.2
6.12
23.21
96.8
18
0.30 54.0(23.1) 17.7
a
19.5
b
67.2
a
3.3
84.3
a
1.41
a
1.4
6.44
23.97
IR 1000W
61.3
54
0.11 54.0(23.7) 19.6
c
19.2
a
69.2
b
3.5
97.5
c
1.62
c
1.1
6.21
24.01
80.9
30
0.21 54.0(23.1) 18.6
b
19.6
a
63.7
a
4.0
88.3
a
1.92
d
1.3
5.98
23.65
95.8
24
0.26 54.0(22.5) 17.8
a
19.2
a
66.7
b
3.0
86.5
a
1.47
b
1.2
6.06
22.94
HA
61.1
87
0.07 54.0(22.0) 22.4
a
18.2
a
69.8
a
3.8
92.4
a
1.32
ab
1.1
6.12
23.54
78.6
54
0.11 54.0(23.0) 19.6
b
18.8
b
69.6
a
3.5
91.3
a
1.86
c
1.4
5.98
22.87
100
39
0.16 54.0(22.1) 19.9
b
19.8
c
70.5
a
4.0
94.2
a
1.25
a
1.2
6.20
23.90
*
IMC (FMC)
is initial moisture content (final moisture content (%dry-basis)
, ns
is not significantly different at 95% confident limit (p 0.5)
Control rice
is parboiled rice which was dried by ambient air,
Reference
rice
is raw rice which was not parboiled rice
the highest correlation coefficient and the lowest value of
least root mean square error. Finally, the EMC of
GAB’s
model was the best fitting model for predicting the
equilibrium moisture content experimented values as
shown as follows:
RH) × 0.683 × 6.611 +RH× 0.683 -
0.683)(1
-1(
RH×683 .0×611 .6× 050 .0
=M
eq
(4)
R
2
= 0.922 RMSE = 0.110
C. Effective Diffusion Coefficient (D
eff
)
Effective diffusion coefficients evaluated by The
Fick’s diffusion law
were illustrated in Fig. 2. The results
showed that the effective diffusion coefficient of IR
drying was slightly higher than those of combined
HA+IR and HA drying. Effective diffusion coefficient
equations of each drying strategies were shown in Table
2.
D. Determination of rice quality
1. Head rice yield (HRY)
The relationship between HRY value and drying
temperature present in Table 3. Parboiled rice with initial
moisture content 54±1 % dry-basis dried with different
drying strategies provided HRY ranging between 63.7
and 70.6%. The results implied that head rice yield of
parboiled rice is relatively higher than reference rice. This
is because soaking, tempering and drying let starch inside
rice kernels gelatinize. This is corresponded to the
previous works [15-17, 19]. To compare with reference
TABLE
II
E
FFECTIVE DIFFUSION COEFFICIENT EQUATIONS OF DIFFERENT DRYING
STRATEGIES
Drying condition Effective diffusion equation
R
2
RMSE
IR 1500W D
eff
=9.04x10
-5
exp(-31562/RT) 0.953
0.104
IR 1000W
D
eff
=4.73x10
-5
exp(-29420/RT) 0.936
0.126
HA+IR 1500W D
eff
=1.10x10
-5
exp(-25313/RT) 0.986
0.052
HA+IR 1000W D
eff
=4.17x10
-6
exp(-22872/RT) 0.946
0.007
HA
D
eff
=8.47x10
-7
exp(-19789/RT) 0.959
0.006


