2011 International Conference on Alternative Energy in Developing Countries and Emerging Economies
- 293 -
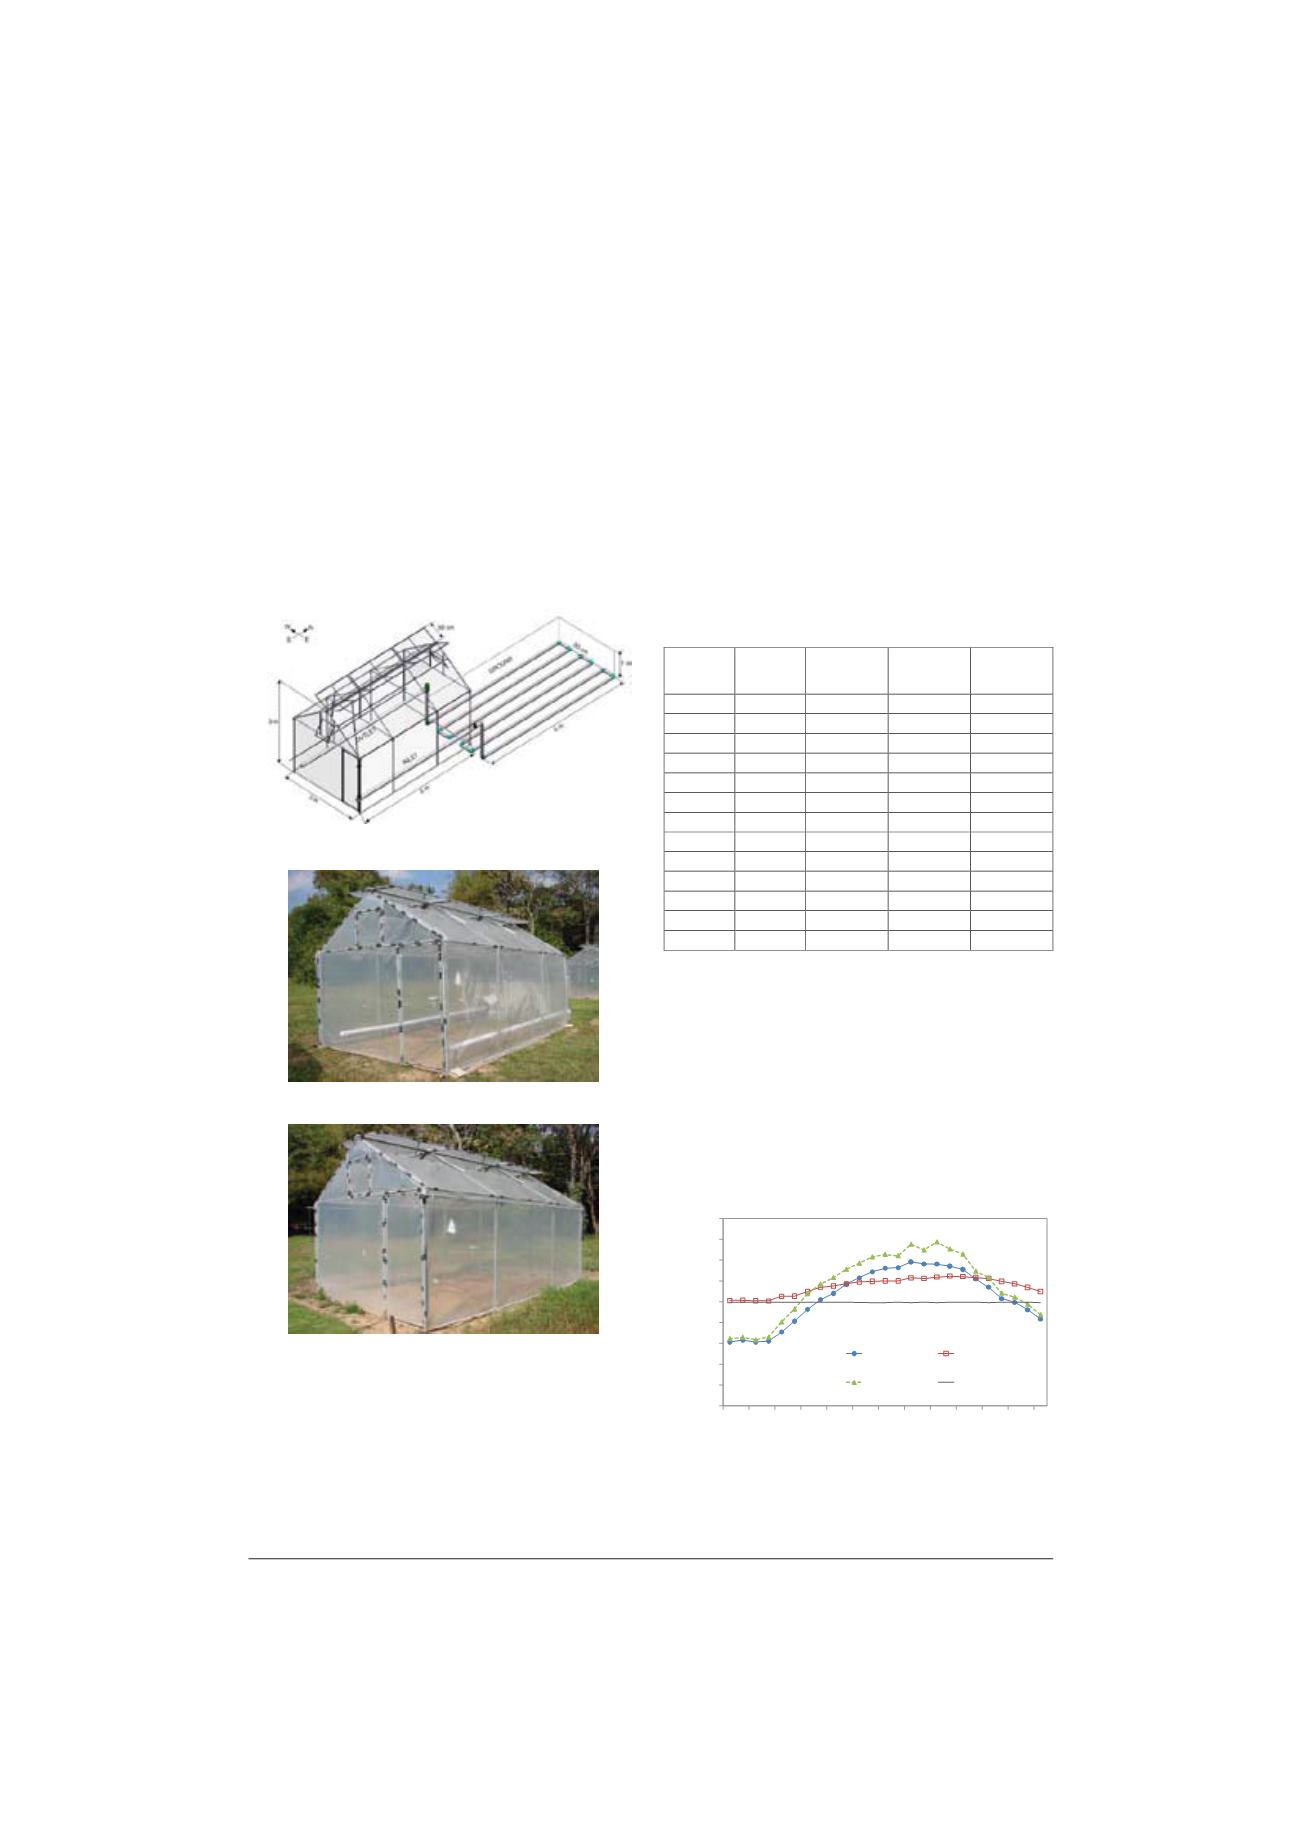
B. Earth tube system (ETS)
The earth tubes were made from iron with coating of
rustproof had 0.08 m diameter and 2 mm thickness. The
38.5m serpentine tubes were placed at 1 m depth under a
lawn surface near the north wall. The air circulation
consisted of the suction tube on the east and the discharge
tube with rubber insulation in the west. Both tubes made
from poly-vinyl chloride with 0.08 m diameter, 4.75 m
length were holed for the air distribution throughout the
Model GH. Air flow rate in earth tube was controlled by
a 120W centrifugal blower installed at the end point of
the buried tube. The experimental GHs were shown in
Fig. 1 and 2, respectively.
Fig. 1 Isometric of model GH.
(a)
The model GH
(b) The control GH
Fig.
2. View of experimental GHs.
C. Experimental Set-up
The experiments were undertaken in 3 periods such as
winter (December 2009), summer (May 2010) and rainy
season (August 2010) during daytime beginning at 6 a.m.
to 6 p.m. The thermocouple type K (Range -200
o
C to
1,350
o
C) was used to measure for dry bulb temperature,
wet bulb temperature, inflow temperature, outflow
temperature, soil temperature at 1 m depth. The solar
radiation was measured by solar integration model
NECTEC KMUTT (Resolution
r
1 W/m
2
). All data were
recorded in the YOKOGAWA multi - channel data
recorder.
III. R
ESULT AND
D
ISCUSSION
A. Winter micro climate
TABLE
I
H
OURLY WEATHER DATA OF WINTER
,
A TYPICAL DAY
ON
D
ECEMBER
23, 2009
Time (h)
Solar
radiation
(W/m
2
)
Ambient
temp.
(
o
C)
Ambient
RH.
(%)
Soil temp.
at 1 m
(
o
C)
6 a.m.
0.00
15.35
96.92
25.00
7 a.m.
35.22
14.80
100.00
24.90
8 a.m.
134.55
16.25
99.50
24.90
9 a.m.
320.64
21.45
67.32
24.90
10 a.m.
479.04
23.90
59.72
24.90
11 a.m.
607.17
25.95
57.31
24.90
12 a.m.
687.85
27.90
50.70
24.80
1
p.m.
667.91
29.65
46.10
24.80
2
p.m.
675.11
32.00
35.09
24.80
3
p.m.
491.04
31.50
33.81
24.90
4
p.m.
313.63
28.45
41.86
24.80
5
p.m.
66.06
24.65
64.44
24.90
6
p.m.
30.98
21.55
66.64
24.80
Table I presents the measured weather data in a typical
day of winter. The data of December 23, 2009 consisted
of the solar radiation, ambient temperature, relative
humidity (RH) and soil temperature at 1 m depth. In
winter, the sky was clearly and the solar radiation was
lower than other season which the average maximum
radiation was generally in the range 700 - 800 W/m
2
.
Surrounding temperature was low in the morning and
evening except during the noon, the temperature was
largely increased therefore the RH was reduced. The soil
temperature at 1 m depth was relatively constant
approximately 25
o
C.
0
5
10
15
20
25
30
35
40
45
6:00AM
7:00AM
8:00AM
9:00AM
10:00AM
11:00AM
12:00PM
1:00PM
2:00PM
3:00PM
4:00PM
5:00PM
6:00PM
Temperature
(
0
C)
Time (hr)
inletair
outletair
modelGH soilat 1 m
Fig. 3. Temperature of working fluid in a typical day of winter.


